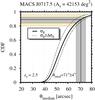
Fig. 9
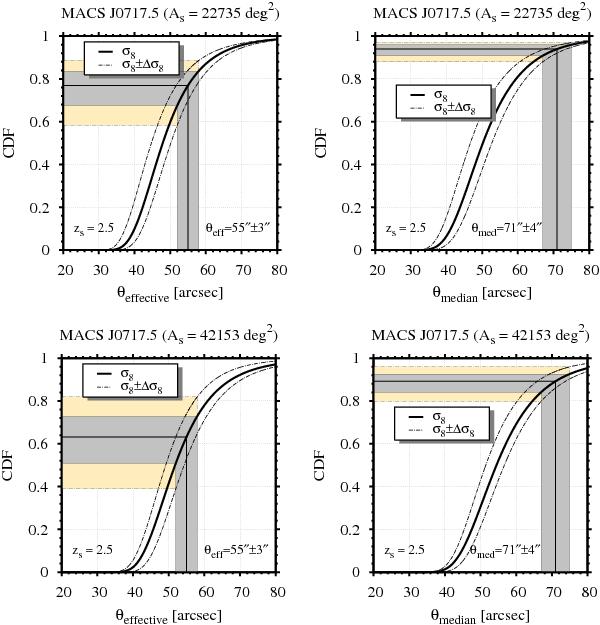
CDFs of the largest effective (left panel) and median (right panel) Einstein radius, assuming a redshift interval of 0.5 ≤ z ≤ 1.0, a source redshift of zs = 2.5 and the nominal MACS survey area (upper panels) as well as the full sky (lower panels). Both distributions are based on the Tinker et al. (2008) mass function and the simulation of 1000 maxima with Mlim = 2×10¹⁴ M⊙ / h on the full sky. The dashed-dotted lines, together with the yellow shaded area, illustrate the impact of the uncertainty in the WMAP7 value of σ8 on the CDFs and the grey shaded area denotes the uncertainty in the measurement of the Einstein radius.
Current usage metrics show cumulative count of Article Views (full-text article views including HTML views, PDF and ePub downloads, according to the available data) and Abstracts Views on Vision4Press platform.
Data correspond to usage on the plateform after 2015. The current usage metrics is available 48-96 hours after online publication and is updated daily on week days.
Initial download of the metrics may take a while.