Fig. 6
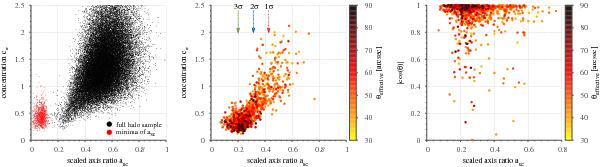
The left-hand and centre panels show the distribution in scaled axis ratio asc and concentration ce of sampled haloes, according to different selection criteria. The left-hand panel shows the distribution of a full halo sample of a single realisation (black dots) and the sample of the minima in asc from 1000 realisations (red dots). The centre panel shows the distribution of the haloes that give rise to the largest effective Einstein ring (encoded in the colourbar) based on 1000 realisations. The small arrows denote the indicated cut-offs identical to . The right-hand panel shows the distribution of the same maxima with respect to the scaled axis ratio and the alignment | cosθ | , where θ is the angle between the major axis of each halo with respect to the line of sight.
Current usage metrics show cumulative count of Article Views (full-text article views including HTML views, PDF and ePub downloads, according to the available data) and Abstracts Views on Vision4Press platform.
Data correspond to usage on the plateform after 2015. The current usage metrics is available 48-96 hours after online publication and is updated daily on week days.
Initial download of the metrics may take a while.