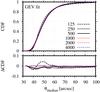
Fig. 2
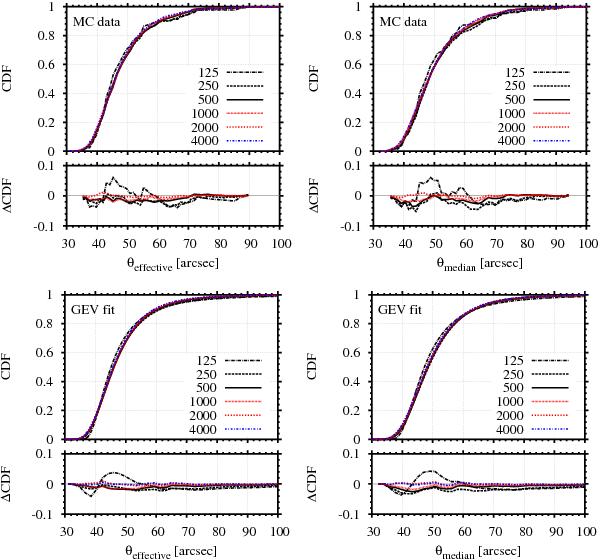
CDFs of the largest effective (left panels) and median (right panels) Einstein radius for a different number of maxima in the range between 125 and 4000, assuming the Tinker et al. (2008) mass function, Mlim = 2×10¹⁴ M⊙ / h and the redshift interval of 0.5 ≤ z ≤ 1.0 on the full sky. The upper row shows the CDFs directly based on the MC simulations, and the lower row presents the corresponding fits of the GEV distribution. The small lower panels show the difference, ΔCDF, with respect to the high-resolution run based on 4000 maxima.
Current usage metrics show cumulative count of Article Views (full-text article views including HTML views, PDF and ePub downloads, according to the available data) and Abstracts Views on Vision4Press platform.
Data correspond to usage on the plateform after 2015. The current usage metrics is available 48-96 hours after online publication and is updated daily on week days.
Initial download of the metrics may take a while.