Fig. 1
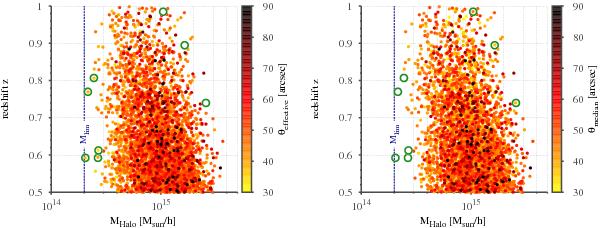
Distribution in mass and redshift of 4000 maxima of the effective (left panel) and the median Einstein radius (right panel) in the redshift interval of 0.5 ≤ z ≤ 1.0 on the full sky based on the Tinker et al. (2008) mass function. The colour encodes the size of the individual largest Einstein radius from each simulation run. The green circles denote exemplary systems for which the two Einstein radius definitions selected different haloes as the maximum.
Current usage metrics show cumulative count of Article Views (full-text article views including HTML views, PDF and ePub downloads, according to the available data) and Abstracts Views on Vision4Press platform.
Data correspond to usage on the plateform after 2015. The current usage metrics is available 48-96 hours after online publication and is updated daily on week days.
Initial download of the metrics may take a while.