Fig. 1
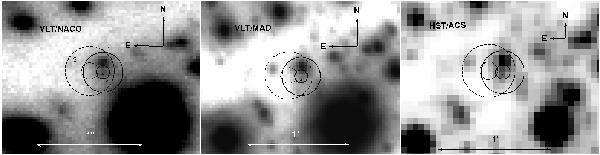
Map of 1.5′′ × 1.5′′ area surrounding the position of IGR J17480. Left panel: VLT/NACO image (this work), with superimposed error circles drawn at 1σ and 3σ radii of the X-ray transient positions obtained from Chandra (dashed circles) and the Moon occultation method (solid circles). X-Ray transients positions are computed combining the errors given by the authors (0.04′′ for MO, 0.06′′ for Chandra) and the uncertainty on the astrometric fit (0.05′′). Central panel: VLT/MAD image. Right panel: HST/ACS image in the F606W filter. The three sources inside the error boxes are marked as well. Source #2, marked with a dot, is the candidate counterpart (see text).
Current usage metrics show cumulative count of Article Views (full-text article views including HTML views, PDF and ePub downloads, according to the available data) and Abstracts Views on Vision4Press platform.
Data correspond to usage on the plateform after 2015. The current usage metrics is available 48-96 hours after online publication and is updated daily on week days.
Initial download of the metrics may take a while.