Free Access
Fig. 8
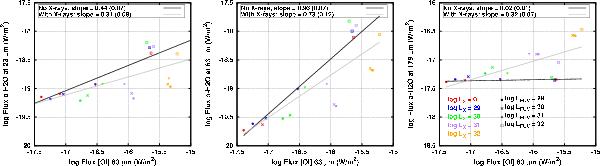
Correlation of water lines with the [O i] 63 μm lines. From left to right: 23 μm, 63 μm, and 179 μm. Color coded is LX; different symbols indicate different FUV luminosities. The linear fit for the UV only model and the UV+X-rays model are drawn with a black and grey line, respectively.
Current usage metrics show cumulative count of Article Views (full-text article views including HTML views, PDF and ePub downloads, according to the available data) and Abstracts Views on Vision4Press platform.
Data correspond to usage on the plateform after 2015. The current usage metrics is available 48-96 hours after online publication and is updated daily on week days.
Initial download of the metrics may take a while.