Fig. 4
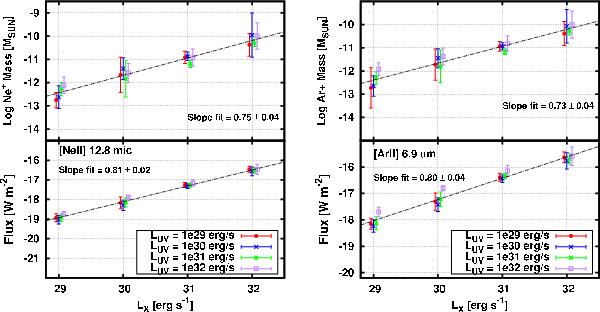
From lower to upper panel: flux of the line, mass averaged temperature and total species mass in the disk versus X-ray luminosity. See Sect. 3 for the description of the error bars. Left figure: ionized neon fine-structure line emission at 12.8 μm. The line is produced in a high-temperature X-ray heated environment, where the density is low (nH ~ 106 − 7 cm-3). The line is optically thin and hence very sensitive to the total ionized neon mass, which correlates with LX. Hence, in our models, [Ne ii] correlates with LX. Right figure: ionized argon fine-structure line emission at 6.9 μm. [Ar ii] behave very similarly to [Ne ii], and it can be used as a tracer for the same region.
Current usage metrics show cumulative count of Article Views (full-text article views including HTML views, PDF and ePub downloads, according to the available data) and Abstracts Views on Vision4Press platform.
Data correspond to usage on the plateform after 2015. The current usage metrics is available 48-96 hours after online publication and is updated daily on week days.
Initial download of the metrics may take a while.