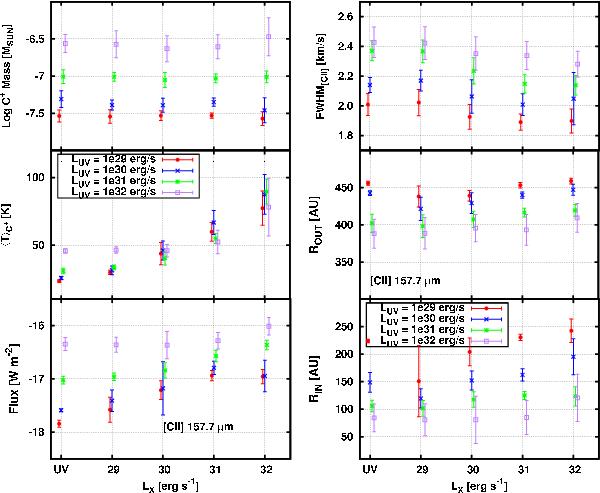
Fig. 3

Lower and central panel: inner and outer radius of the emitting region. Top panel: FWHM of the line. See Sect. 3 for the description of color coding and error bars. LEFT figure: [O i] at 63 μm. The oxygen line-emitting region is generally pushed further as LX increases, this is also reflected by the FWHM, which on average slightly decreases with LX. Right panel: [C ii] at 157.7 μm. Ionized carbon traces the outer disk, its emitting region extends inward as LFUV increases. X-rays do not impact considerably RIN, ROUT or the FHWM of the line.
Current usage metrics show cumulative count of Article Views (full-text article views including HTML views, PDF and ePub downloads, according to the available data) and Abstracts Views on Vision4Press platform.
Data correspond to usage on the plateform after 2015. The current usage metrics is available 48-96 hours after online publication and is updated daily on week days.
Initial download of the metrics may take a while.


