Fig. 2
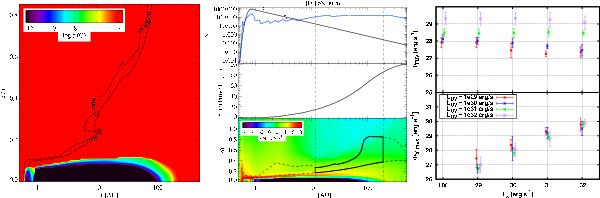
Left panel: O abundance (relative to hydrogen nuclei). The black contours are iso-temperature curves at 200 and 1000 K. Central panel: optical depth of the line (blue) and of the continuum (black) in the top mini-panel, below is the cumulative flux of the line, which shows which percent of the final flux is built and where, the lower mini-panel shows the oxygen density, the contour indicates where the contribution to the line flux goes vertically from 15% to 85% at every radius. Right panel: FUV (top) and X-ray (bottom) heating rates. These rates are obtained integrating the volumetric heating rate Γ over the volume of the [OI] emitting region for every model. Averages and error bars have the same meaning as described in Sect. 3. The first two panels are taken from a representative model with LX = 1030 erg s-1, LFUV = 1031 erg s-1, amin = 0.1 μm, apow = 3.5, and ϵ = 1.5.
Current usage metrics show cumulative count of Article Views (full-text article views including HTML views, PDF and ePub downloads, according to the available data) and Abstracts Views on Vision4Press platform.
Data correspond to usage on the plateform after 2015. The current usage metrics is available 48-96 hours after online publication and is updated daily on week days.
Initial download of the metrics may take a while.