Free Access
Fig. 5
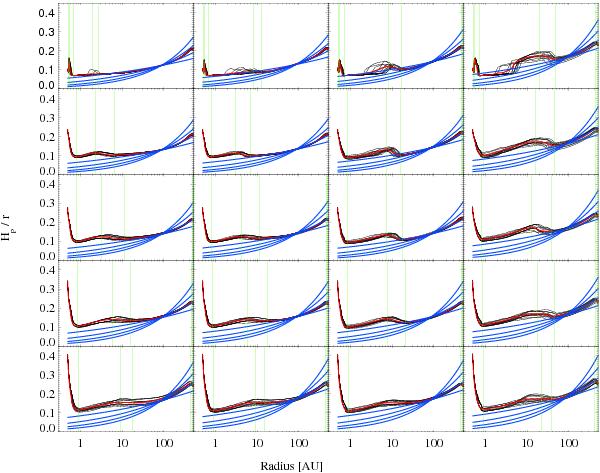
Scale height of the disk at z/r = 0.5. The black lines show the 12 different models (amin, amax, and ϵ), at a particular LFUV and LX. The vertical green lines indicate a maximum or minimum in the scale height. The red line is the average of the 12 models.
Current usage metrics show cumulative count of Article Views (full-text article views including HTML views, PDF and ePub downloads, according to the available data) and Abstracts Views on Vision4Press platform.
Data correspond to usage on the plateform after 2015. The current usage metrics is available 48-96 hours after online publication and is updated daily on week days.
Initial download of the metrics may take a while.