Fig. 5
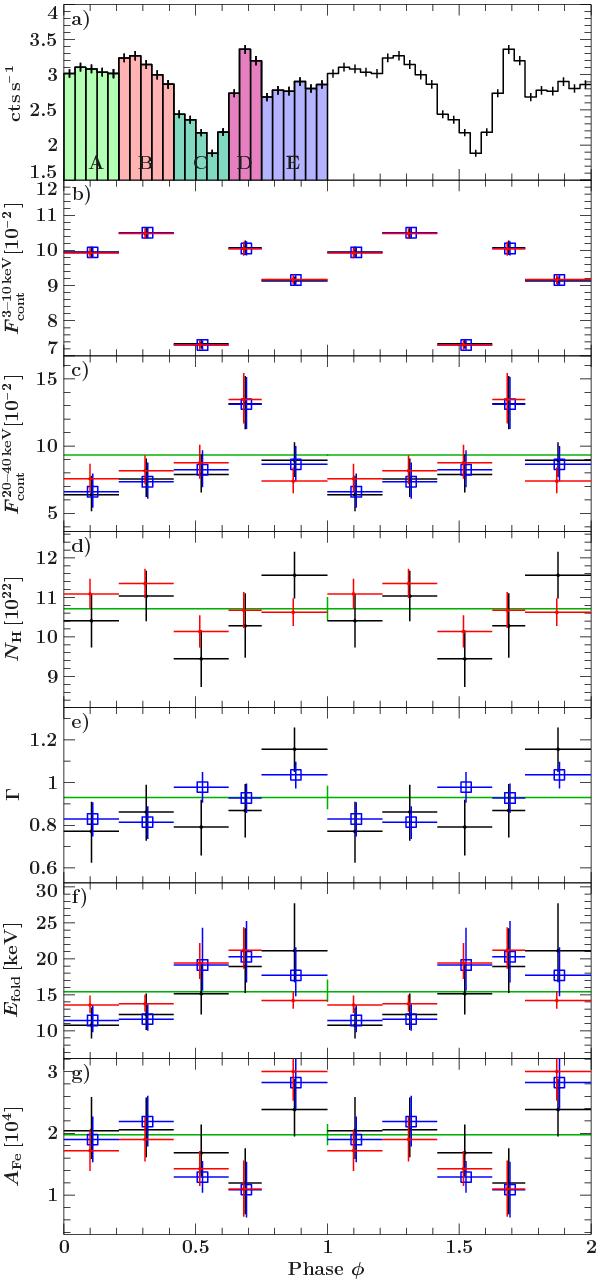
Results of the phase resolved spectroscopy. In black the fit without any fixed parameters is shown, for the blue data points the NH was frozen, for the red the photon index Γ. In green the results of the phase averaged fit are shown. a) XIS0 pulse-profile in the 0.5–10 keV range; b) flux between 3–10 keV in keV s cm; c) flux between 20–40 keV in keV s cm; d) absorption column density; e) photon index; f) folding energy; g) flux of the iron line in ph s cm.
Current usage metrics show cumulative count of Article Views (full-text article views including HTML views, PDF and ePub downloads, according to the available data) and Abstracts Views on Vision4Press platform.
Data correspond to usage on the plateform after 2015. The current usage metrics is available 48-96 hours after online publication and is updated daily on week days.
Initial download of the metrics may take a while.