Fig. 4
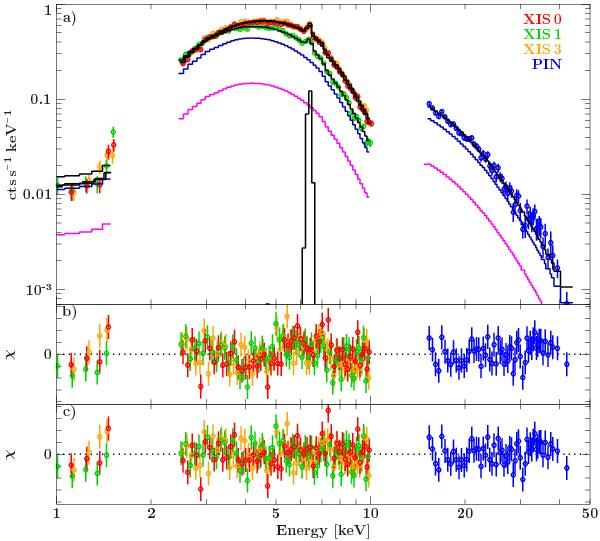
a) XIS0 (red), XIS1 (green), XIS3 (orange), and PIN (blue) spectrum together with the best fit cutoffpl-model including partial covering. In magenta the strongly absorbed part is shown, in dark blue the less absorbed one. The Fe Kα line is shown in brown. b) residuals to the cutoffpl model without partial coverer. c) residuals to the best-fit model.
Current usage metrics show cumulative count of Article Views (full-text article views including HTML views, PDF and ePub downloads, according to the available data) and Abstracts Views on Vision4Press platform.
Data correspond to usage on the plateform after 2015. The current usage metrics is available 48-96 hours after online publication and is updated daily on week days.
Initial download of the metrics may take a while.