Fig. 8
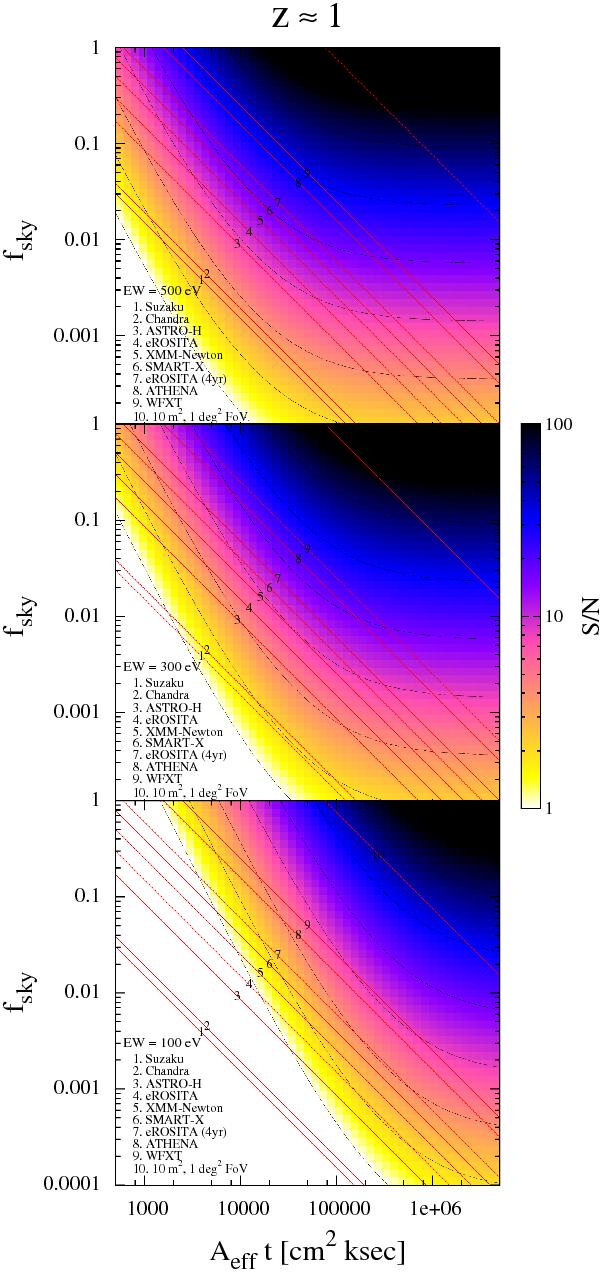
Signal-to-noise ratio of the tomographic signal as a function of the fraction of sky fsky covered in the survey and Aeff × t – a product of the effective area Aeff, at the energy where the tomographic signal is extracted, and the time t spent per field. The dashed S/N contours correspond to values 1, 2, 4, 8, 16, 32, and 64. The straight lines show the locus of the points, which can be achieved in the course of a 1-year survey (4 years for eROSITA) by various currently existing, near-term, and possible future X-ray instruments. The panels show results for different values of the 6.4 keV line equivalent width: 500 eV (top panel), 300 eV (middle) and 100 eV (bottom). Observational energy bands 3.0−3.2 keV and 3.3−3.5 keV, corresponding to z ≃ 1, are assumed.
Current usage metrics show cumulative count of Article Views (full-text article views including HTML views, PDF and ePub downloads, according to the available data) and Abstracts Views on Vision4Press platform.
Data correspond to usage on the plateform after 2015. The current usage metrics is available 48-96 hours after online publication and is updated daily on week days.
Initial download of the metrics may take a while.