Fig. 4
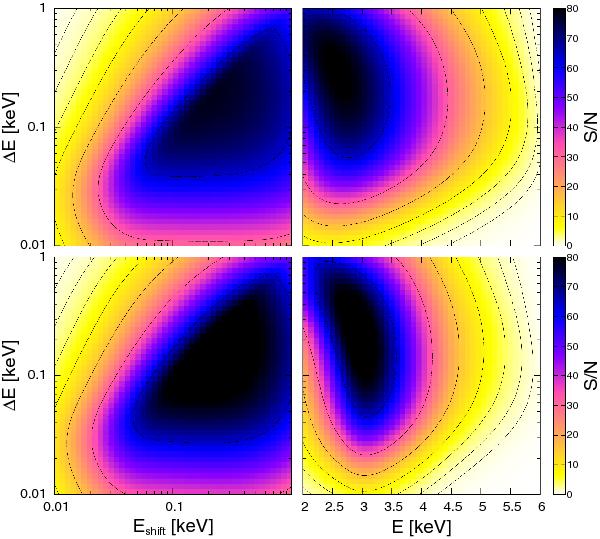
Signal-to-noise ratio according to Eq. (22) with ℓmax = 500. Flim = 10-13 erg/s/cm2 along with 500 counts at this flux is assumed. The upper and lower panels correspond to Models I and II, respectively. In the left-hand panels we show S/N as a function of ΔE and Eshift while keeping E fixed to 3.0 keV. The right-hand panels display S/N as a function of E and ΔE by keeping Eshift equal to ΔE. The dashed S/N contours correspond to values 1, 2, 4, 8, 16, and 32.
Current usage metrics show cumulative count of Article Views (full-text article views including HTML views, PDF and ePub downloads, according to the available data) and Abstracts Views on Vision4Press platform.
Data correspond to usage on the plateform after 2015. The current usage metrics is available 48-96 hours after online publication and is updated daily on week days.
Initial download of the metrics may take a while.