Fig. 3
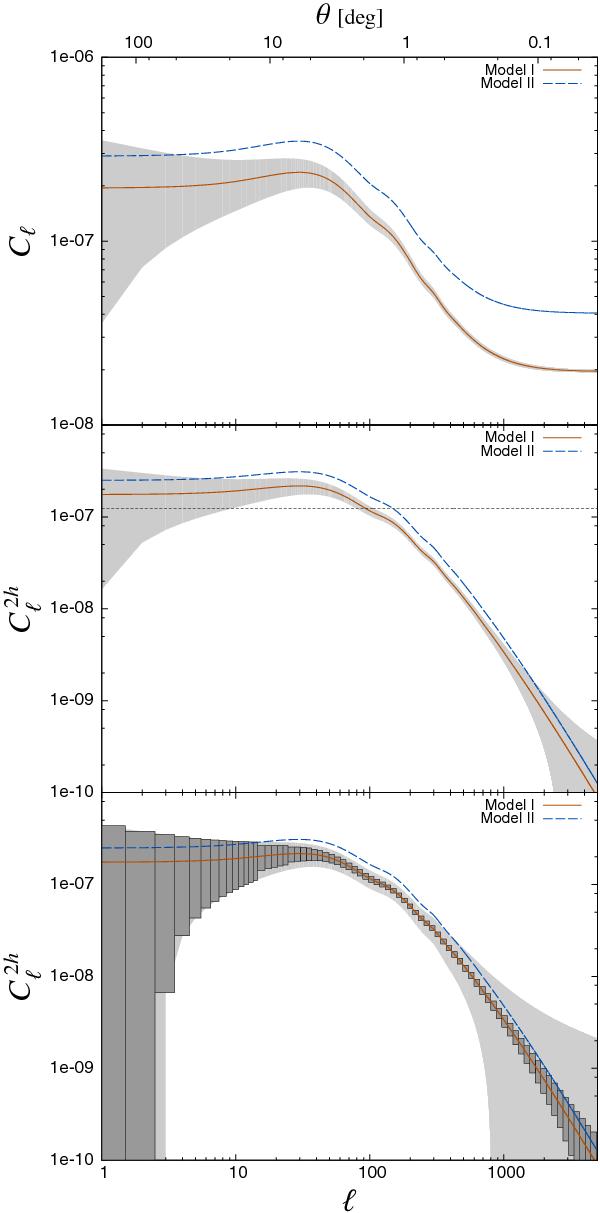
Angular power spectra for the extracted line signal assuming energy bins 3.0−3.2 keV and 3.3−3.5 keV along with Flim = 10-13 erg/s/cm2. For clarity the errors are only displayed for Model I. To calculate the level of photon noise we have assumed that flux 10-13 erg/s/cm2 corresponds to 500 counts. Upper panel: angular spectra including two- and one-halo terms. The gray shaded area shows 1σ uncertainty region as calculated from Eq. (18). Here we have assumed perfect photon sampling, i.e., the photon noise is taken to be zero. Middle panel: angular power spectra with one-halo term subtracted. The gray band shows error corridor as calculated from Eq. (19). The level of photon noise, which is not yet included in calculation of errors, is shown by a short-dashed line. Lower panel: the same as middle panel but with the effect of photon noise included (Eq. (21)). The light gray band and dark gray histogram present errors without and with binning, respectively.
Current usage metrics show cumulative count of Article Views (full-text article views including HTML views, PDF and ePub downloads, according to the available data) and Abstracts Views on Vision4Press platform.
Data correspond to usage on the plateform after 2015. The current usage metrics is available 48-96 hours after online publication and is updated daily on week days.
Initial download of the metrics may take a while.