Fig. 2
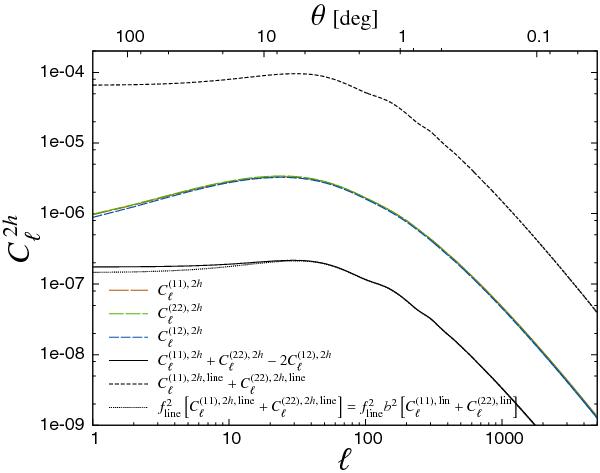
Two-halo terms of angular auto and cross power spectra for Model I assuming two
observational energy ranges: (1) 3.0−3.2 keV and (2) 3.3−3.5 keV and fixing
Flim to 10-13 erg/s/cm2, as in
Fig. 1. The three dashed lines with
intermediate amplitude represent auto-spectra in energy bin 1
( )
and bin 2 (
)
and bin 2 ( )
along with the corresponding cross-spectrum (
)
along with the corresponding cross-spectrum ( )
(all three lines are on top of each other, with
being slightly lower at small ℓ). The solid line shows the signal
after removal of the continuum part, i.e.,
)
(all three lines are on top of each other, with
being slightly lower at small ℓ). The solid line shows the signal
after removal of the continuum part, i.e.,  .
The short-dashed line with the highest amplitude corresponds to the sum of
autocorrelations of bin 1 and 2 in case there is only signal from 6.4 keV line and
no continuum contribution. The same curve multiplied by
.
The short-dashed line with the highest amplitude corresponds to the sum of
autocorrelations of bin 1 and 2 in case there is only signal from 6.4 keV line and
no continuum contribution. The same curve multiplied by
 (the
square of fraction of photons from the line) is plotted as a dotted line, which is
also equivalent to the corresponding sum of linear spectra multiplied by
(the
square of fraction of photons from the line) is plotted as a dotted line, which is
also equivalent to the corresponding sum of linear spectra multiplied by
 , where
b is the linear clustering bias parameter (in current case
b ≃ 2.5 and fline ≃ 0.047).
, where
b is the linear clustering bias parameter (in current case
b ≃ 2.5 and fline ≃ 0.047).
Current usage metrics show cumulative count of Article Views (full-text article views including HTML views, PDF and ePub downloads, according to the available data) and Abstracts Views on Vision4Press platform.
Data correspond to usage on the plateform after 2015. The current usage metrics is available 48-96 hours after online publication and is updated daily on week days.
Initial download of the metrics may take a while.