Fig. 8
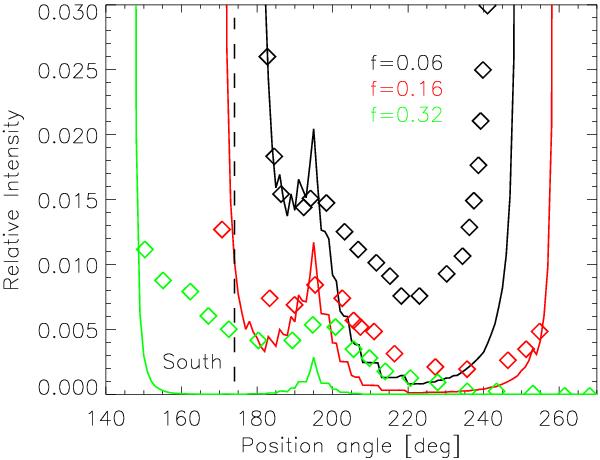
Relative intensity against position angle from G-band observations (symbols) at the Dutch Open Telescope on La Palma (Spain) and modeling in this work at 0.43 μm (solid) for the egress during the 2004 Venus transit. The intensities and position angle are defined by Tanga et al. (2012). To reproduce the peak in brightness away from the South Pole, we needed to shift the reference hcloud-latitude profile by about 20°. For a color version of the figure, see the electronic journal.
Current usage metrics show cumulative count of Article Views (full-text article views including HTML views, PDF and ePub downloads, according to the available data) and Abstracts Views on Vision4Press platform.
Data correspond to usage on the plateform after 2015. The current usage metrics is available 48-96 hours after online publication and is updated daily on week days.
Initial download of the metrics may take a while.