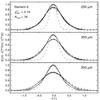
Fig. 2
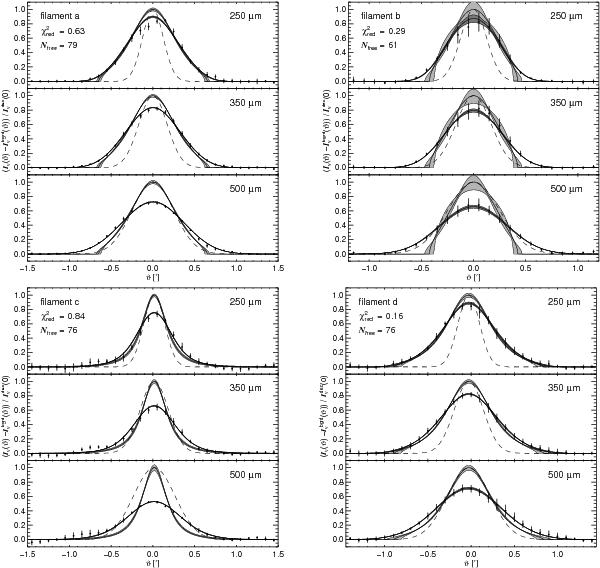
Surface brightness profiles of the filaments at 250, 350, and 500 μm, normalized by the central surface brightness of the intrinsic model, before convolution. The model is optimized so that after convolution it matches the data. Note that the multi wavelength data simultaneously fit the SED (Fig. 3). The light grey shaded area shows the 1σ variations of the intrinsic surface brightness profiles of the model. The best fit model of the data has a peak less than unity because of convolution with the beam; the 1σ variations (most easily seen for filament b) are shown by the dark areas. The data that were fit, corrected using the best fit for the background emission, are shown as points with error bars normalized to the best fit model. The adopted Gaussian approximations of the psf are given as dashed lines. North is to the right. Note that the scan lengths vary from filament to filament.
Current usage metrics show cumulative count of Article Views (full-text article views including HTML views, PDF and ePub downloads, according to the available data) and Abstracts Views on Vision4Press platform.
Data correspond to usage on the plateform after 2015. The current usage metrics is available 48-96 hours after online publication and is updated daily on week days.
Initial download of the metrics may take a while.