Fig. 7
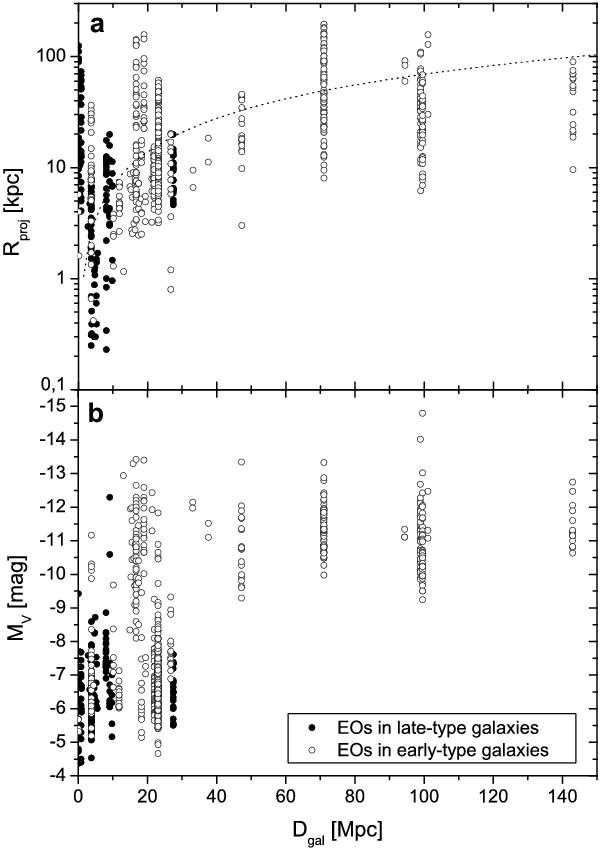
a) Projected distances of EOs from their host galaxies are plotted against the distance of the host galaxies. The dotted curve indicates the largest possible projected radius within a single HST ACS image centered on a galaxy at a given distance. b) Absolute V-magnitudes of EOs are plotted against the distance of the host galaxies.
Current usage metrics show cumulative count of Article Views (full-text article views including HTML views, PDF and ePub downloads, according to the available data) and Abstracts Views on Vision4Press platform.
Data correspond to usage on the plateform after 2015. The current usage metrics is available 48-96 hours after online publication and is updated daily on week days.
Initial download of the metrics may take a while.