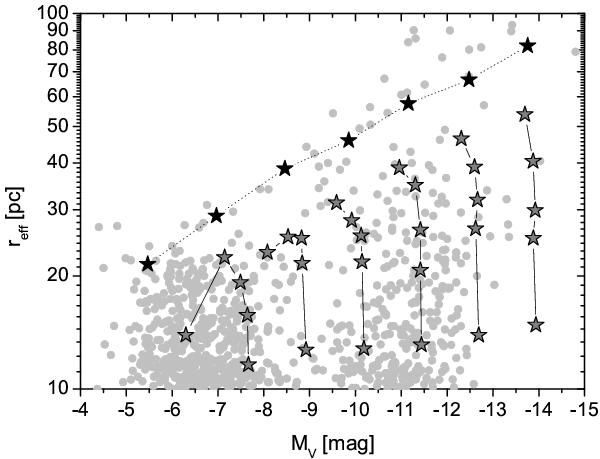
Fig. 20

Diagram of reff as a function of the total luminosity of the observed EOs (grey circles) and the modeled merger objects (stars) from Brüns et al. (2011). Merger objects on eccentric orbits between 20 and 60 kpc are plotted in dark grey. Objects with the same initial CC mass but different initial CC effective radii between 10 and 160 pc are connected by black lines. Merger objects on a circular orbit at 60 kpc and an initial effective radius of the CC of 160 pc are plotted as black stars connected by dotted lines.
Current usage metrics show cumulative count of Article Views (full-text article views including HTML views, PDF and ePub downloads, according to the available data) and Abstracts Views on Vision4Press platform.
Data correspond to usage on the plateform after 2015. The current usage metrics is available 48-96 hours after online publication and is updated daily on week days.
Initial download of the metrics may take a while.


