Fig. 17
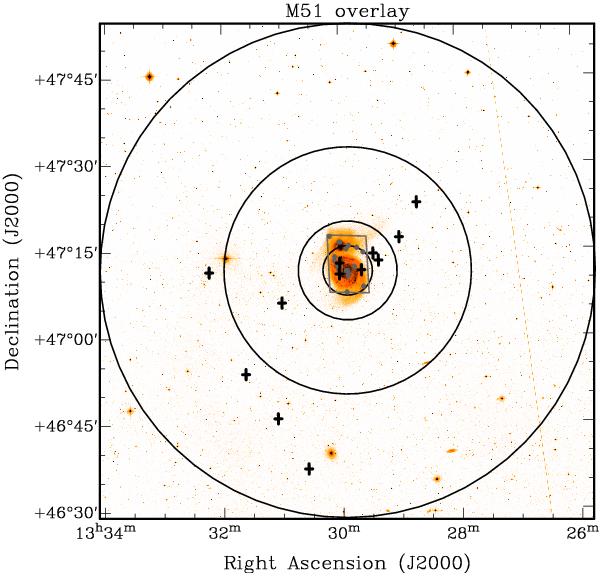
M 51 EOs (grey dots) overlayed on a Digitized Sky Survey 2 (DSS2) image of M 51. The grey lines indicate the size of the HST mosaic of 6 ACS images used by Hwang & Lee (2008) to find EOs in M 51. The black circles indicate projected distances from M 51 of 10, 20, 50, and 100 kpc. For comparison, the projected position of the Milky Way EOs, if the Milky Way would be seen face-on at the distance and the position of M 51, are added as black crosses.
Current usage metrics show cumulative count of Article Views (full-text article views including HTML views, PDF and ePub downloads, according to the available data) and Abstracts Views on Vision4Press platform.
Data correspond to usage on the plateform after 2015. The current usage metrics is available 48-96 hours after online publication and is updated daily on week days.
Initial download of the metrics may take a while.