Free Access
Fig. 16
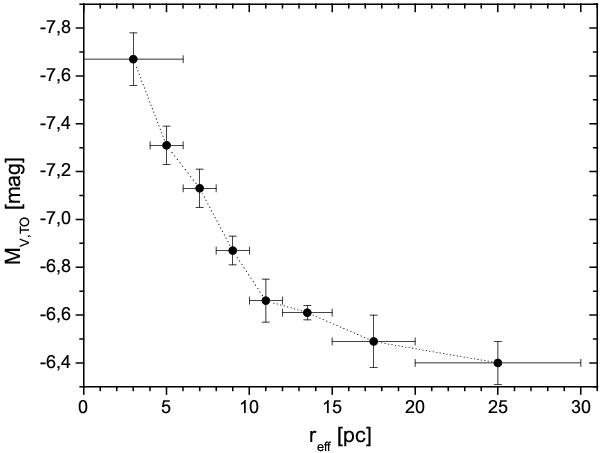
Turnover of the luminosity function, MV,TO, of GCs and EOs plotted as a function of the effective radius. The error bars in reff indicate the individual bin-sizes, the error bars in MV,TO show the statistical error of the fit of the luminosity function to the data.
Current usage metrics show cumulative count of Article Views (full-text article views including HTML views, PDF and ePub downloads, according to the available data) and Abstracts Views on Vision4Press platform.
Data correspond to usage on the plateform after 2015. The current usage metrics is available 48-96 hours after online publication and is updated daily on week days.
Initial download of the metrics may take a while.