Free Access
Fig. 14
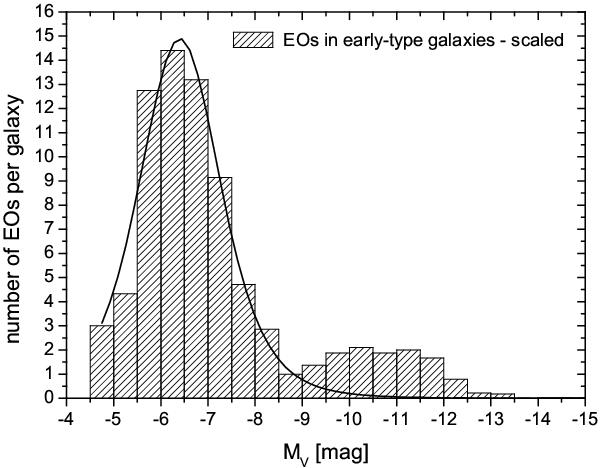
Histogram of the normalized number of EOs in early-type galaxies at different total V-magnitudes scaled by the number of galaxies having observations at the individual bins. The black line represents a fitted t5 luminosity function.
Current usage metrics show cumulative count of Article Views (full-text article views including HTML views, PDF and ePub downloads, according to the available data) and Abstracts Views on Vision4Press platform.
Data correspond to usage on the plateform after 2015. The current usage metrics is available 48-96 hours after online publication and is updated daily on week days.
Initial download of the metrics may take a while.