Free Access
Fig. 11
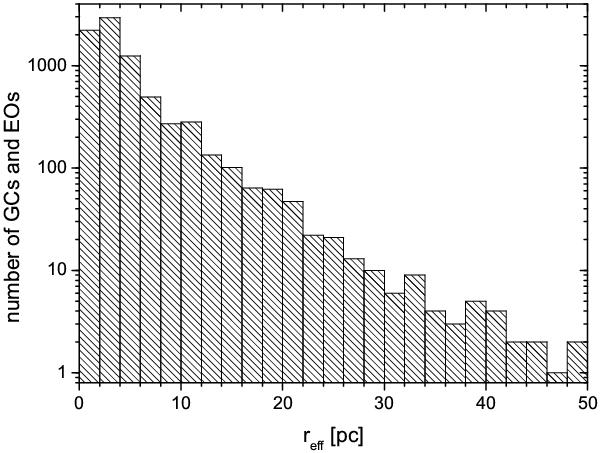
Histogram of the number of star clusters at different effective radii for all GCs and EOs shown in Fig. 10. The slight increase of numbers at 10 pc is due to the fact that all publications of this paper were selected to contain EOs, but not all of them also include GCs.
Current usage metrics show cumulative count of Article Views (full-text article views including HTML views, PDF and ePub downloads, according to the available data) and Abstracts Views on Vision4Press platform.
Data correspond to usage on the plateform after 2015. The current usage metrics is available 48-96 hours after online publication and is updated daily on week days.
Initial download of the metrics may take a while.