Fig. 5
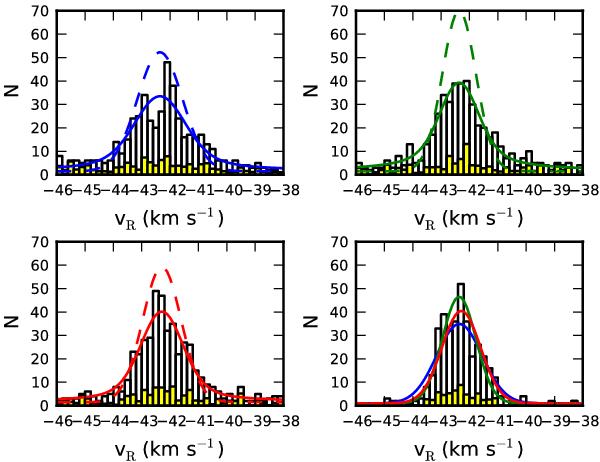
Histograms of the three single-epoch radial velocity distribution from NGC 188 we consider in the top left, top right and bottom left panels, with the probability distribution of the best fitting model overplotted as the solid line for a star of 1 M⊙ and a measurement error of 0.4 km s-1. The intrinsic velocity distributions (Eq. (8)) are plotted as dashed lines. In the bottom right the histogram of the velocities of the single stars identified in Geller et al. (2008) is plotted. The intrinsic velocity distributions (renormalized to the smaller population) computed from the three data sets have been overplotted. All three of these intrinsic velocity distributions are consistent with the velocity distribution of the single stars from Geller et al. (2008) according to a KS-test (see text). In all panels the fraction of every bin expected to consist of non-members (Platais et al. 2003) have been made yellow. The color coding of the lines corresponds to the data set used to fit the model. The first observed epoch has been shown in blue, the second epoch in green, and the last epoch in red.
Current usage metrics show cumulative count of Article Views (full-text article views including HTML views, PDF and ePub downloads, according to the available data) and Abstracts Views on Vision4Press platform.
Data correspond to usage on the plateform after 2015. The current usage metrics is available 48-96 hours after online publication and is updated daily on week days.
Initial download of the metrics may take a while.