Fig. 6
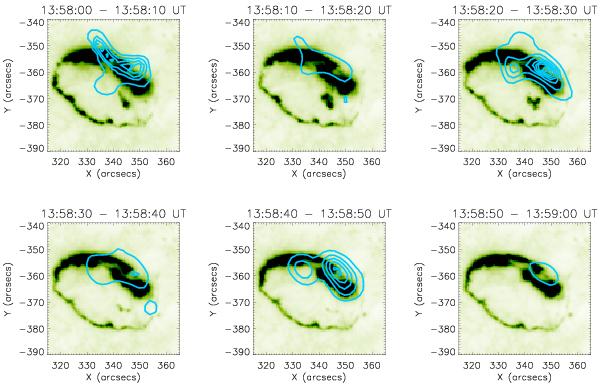
RHESSI contours overplotted on a TRACE background for the 60-s period between 13:58:00 and 13:59:00 UT. The RHESSI images are a 10-s time integration in the energy range 12–25 keV using the PIXON algorithm and detectors 3–8. The RHESSI contours for all images are at the same level at which the maximum X-ray amplitude is fixed at 4.2 photons cm2 s1 asec-2 and each contour represents 10% intervals. The 1600 Å TRACE images are at the central time of the associated RHESSI time integration.
Current usage metrics show cumulative count of Article Views (full-text article views including HTML views, PDF and ePub downloads, according to the available data) and Abstracts Views on Vision4Press platform.
Data correspond to usage on the plateform after 2015. The current usage metrics is available 48-96 hours after online publication and is updated daily on week days.
Initial download of the metrics may take a while.