Fig. 4
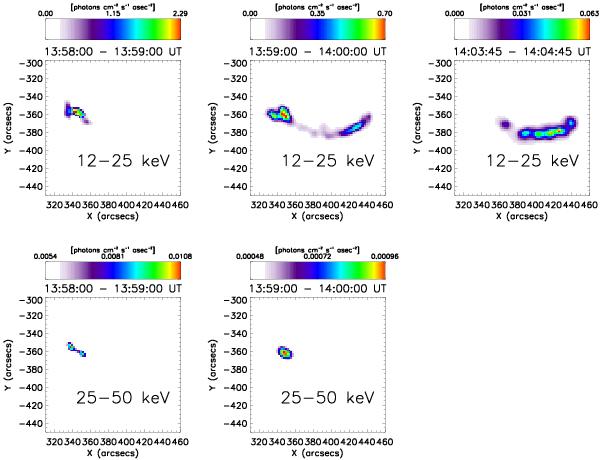
Top: RHESSI pixon images between 12–25 keV using attenuators 3–9. Bottom: RHESSI pixon images between 25–50 keV using attenuators 3–9 at 50–100%. The three time intervals from left to right are 13:58:00–13:59:00 UT, 13:59:00–14:00:00 UT, and 14:03:45–14:04:45 UT. There were not enough counts at the latest time at 25–50 keV to construct a meaningful image. Note that the scale is different for every image and decreased with time.
Current usage metrics show cumulative count of Article Views (full-text article views including HTML views, PDF and ePub downloads, according to the available data) and Abstracts Views on Vision4Press platform.
Data correspond to usage on the plateform after 2015. The current usage metrics is available 48-96 hours after online publication and is updated daily on week days.
Initial download of the metrics may take a while.