Fig. 3
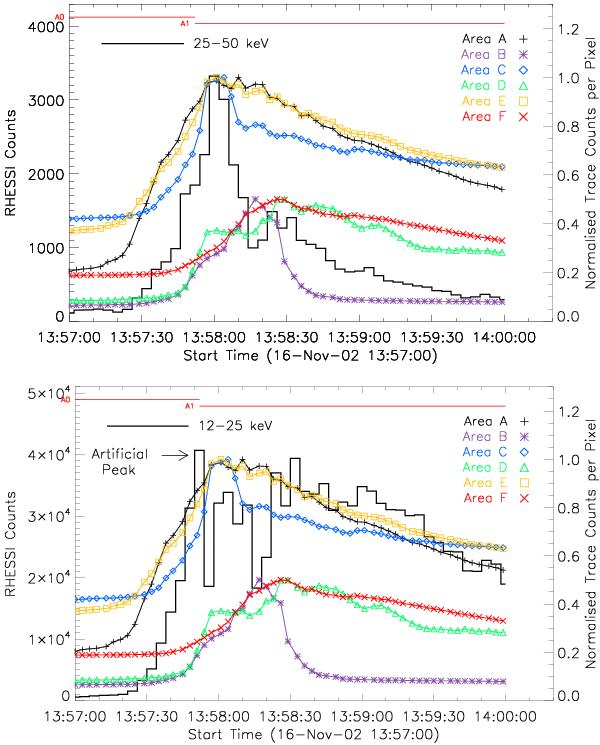
Lightcurves from the TRACE 1600 Å UV regions in Fig. 2 and the RHESSI lightcurves. The yellow/red trace curves (area E, and F) in both graphs correspond to the normalised pixel-averaged counts of the left/right regions in Fig. 2. Areas A, C, and F are normalised to 1 while areas B, D, and E are normalised to 0.5 for clarity. Top: the RHESSI lightcurve for the 25–50 keV energy range in counts. Bottom: the RHESSI lightcurve for the 12–25 keV energy range in counts. Both RHESSI curves use a time resolution of 4 s and all nine detectors. The change in attenuator state from A0 to A1 is also shown in red at the top of both graphs. The change in attenuator creates an artificial peak in the 12–25 keV energy range.
Current usage metrics show cumulative count of Article Views (full-text article views including HTML views, PDF and ePub downloads, according to the available data) and Abstracts Views on Vision4Press platform.
Data correspond to usage on the plateform after 2015. The current usage metrics is available 48-96 hours after online publication and is updated daily on week days.
Initial download of the metrics may take a while.