Fig. 7
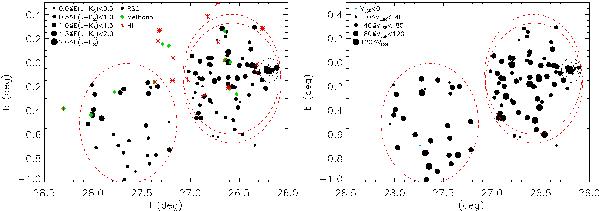
Spatial distribution of red supergiants detected in our survey. Left panel: comparison to other spiral tracers. Black filled circles represent RSGs observed in our survey. Their size is proportional to the estimated E(J − KS), as shown in the legend. Open circles are other RSGs from D07. Diamonds are methanol masers (associated with star-forming regions) taken from Green et al. (2011). Asterisks represent H ii regions observed in radio (Anderson et al. 2011). Right panel: velocity distribution of RSGs. The size of the symbols is proportional to their vLSR. The blue circle represents an RSG with vLSR < 0. In both panels, the nominal position of Ste 2 is indicated by a circle of radius 6′. The large red ovals indicate the field of view of AF2 for the main target area (and the overlapping check exposure) and the control area (to the left).
Current usage metrics show cumulative count of Article Views (full-text article views including HTML views, PDF and ePub downloads, according to the available data) and Abstracts Views on Vision4Press platform.
Data correspond to usage on the plateform after 2015. The current usage metrics is available 48-96 hours after online publication and is updated daily on week days.
Initial download of the metrics may take a while.