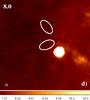
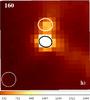
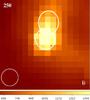
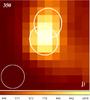
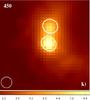
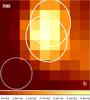
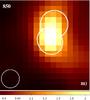
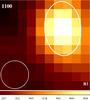
Fig. 1
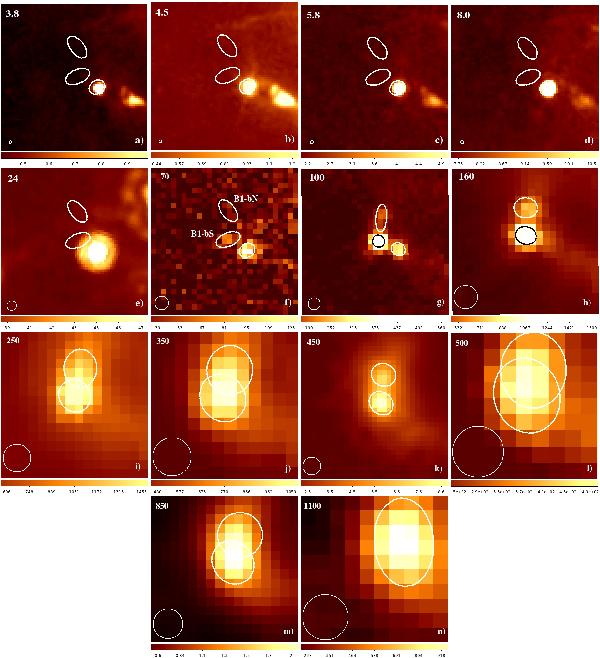
Maps of 1 5 ×
15 of B1-bS
and B1-bN at all wavelengths, with sizes and positions derived from the Gaussian fits.
The FWHM of the respective instrumental beam is shown as a circle in the bottom-left
corner of each respective panel. At λ ≤ 100 μm, the
source S295 is also visible. Colour bars are in Jy/beam for the SCUBA maps, and MJy/sr
in all the others. In the Spitzer images, positions and sizes of the
sources are copied from the 70 μm map. IRAC maps are in the
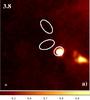
top row, from left to right: a) 3.8 μm;
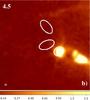
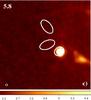
b) 4.5 μm; c) 5.8 μm;
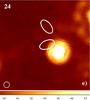
d) 8.0 μm. Second row: e)
Spitzer 24 μm; f) PACS
70 μm, B1-bN is not really detected and its flux corresponds to a
1σ rms point source; g) PACS 100 μm;
h) PACS 160 μm, S295 is no longer visible.
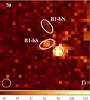
Third row: i) SPIRE 250 μm; j)
SPIRE 350 μm; k) SCUBA 450 μm,
where the beam shown is 11′′, see Appendix A.2; l) SPIRE
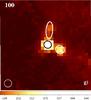
500 μm. Bottom row: m) SCUBA
850 μm; n) Bolocam 1.1 mm, where only one source has
been fitted.
5 ×
15 of B1-bS
and B1-bN at all wavelengths, with sizes and positions derived from the Gaussian fits.
The FWHM of the respective instrumental beam is shown as a circle in the bottom-left
corner of each respective panel. At λ ≤ 100 μm, the
source S295 is also visible. Colour bars are in Jy/beam for the SCUBA maps, and MJy/sr
in all the others. In the Spitzer images, positions and sizes of the
sources are copied from the 70 μm map. IRAC maps are in the
top row, from left to right: a) 3.8 μm;
b) 4.5 μm; c) 5.8 μm;
d) 8.0 μm. Second row: e)
Spitzer 24 μm; f) PACS
70 μm, B1-bN is not really detected and its flux corresponds to a
1σ rms point source; g) PACS 100 μm;
h) PACS 160 μm, S295 is no longer visible.
Third row: i) SPIRE 250 μm; j)
SPIRE 350 μm; k) SCUBA 450 μm,
where the beam shown is 11′′, see Appendix A.2; l) SPIRE
500 μm. Bottom row: m) SCUBA
850 μm; n) Bolocam 1.1 mm, where only one source has
been fitted.
Current usage metrics show cumulative count of Article Views (full-text article views including HTML views, PDF and ePub downloads, according to the available data) and Abstracts Views on Vision4Press platform.
Data correspond to usage on the plateform after 2015. The current usage metrics is available 48-96 hours after online publication and is updated daily on week days.
Initial download of the metrics may take a while.