Free Access
Fig. 6
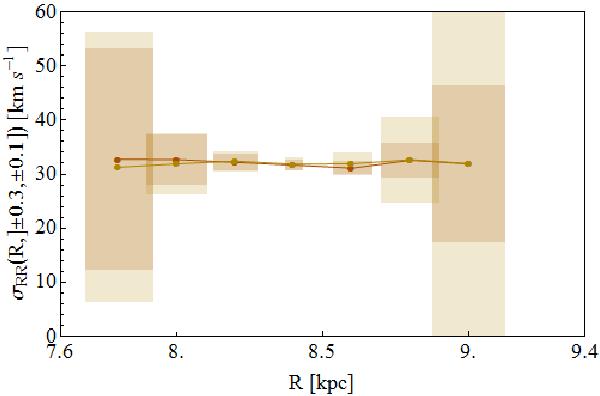
Radial trend of the velocity dispersion element σRR in the vertical interval z ∈]0.1,0.3]kpc (lighter colour) and z ∈] − 0.3, − 0.1]kpc (darker colour). These vertical range intervals were plotted together in order to show the disk symmetry above and below the plane (at z = 0).
Current usage metrics show cumulative count of Article Views (full-text article views including HTML views, PDF and ePub downloads, according to the available data) and Abstracts Views on Vision4Press platform.
Data correspond to usage on the plateform after 2015. The current usage metrics is available 48-96 hours after online publication and is updated daily on week days.
Initial download of the metrics may take a while.