Fig. 4
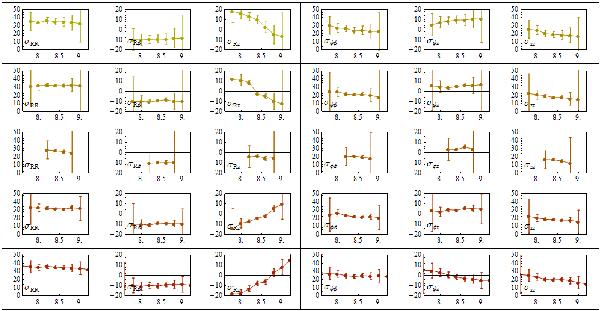
Plot of all the velocity ellipsoid elements σij in the plane (O,R,z). The axes are in [kms-1] for the velocity dispersion (y-axes) and in [kpc] for the Galactocentric distances (x-axes). The axis labels are omitted in favour of a small indicator of the element we are considering in the lower left part of the plot. In order to visualize different z distance ranges, we use a gradation of increasing red for the plot lines from the upper row of plot, z ∈]0.3,0.5] kpc down to the bottom row for the range z ∈] − 0.5,0.3]kpc: the first row of the upper 6 panels refers to z ∈]0.3,0.5]kpc, the second to z ∈]0.1,0.3]kpc, the central to the Galactic plane z ∈] − 0.1,0.1]kpc. The fourth row includes panels for z ∈] − 0.1, − 0.3]kpc and the fifth one to z ∈] − 0.3, − 0.5]kpc.
Current usage metrics show cumulative count of Article Views (full-text article views including HTML views, PDF and ePub downloads, according to the available data) and Abstracts Views on Vision4Press platform.
Data correspond to usage on the plateform after 2015. The current usage metrics is available 48-96 hours after online publication and is updated daily on week days.
Initial download of the metrics may take a while.