Fig. 7
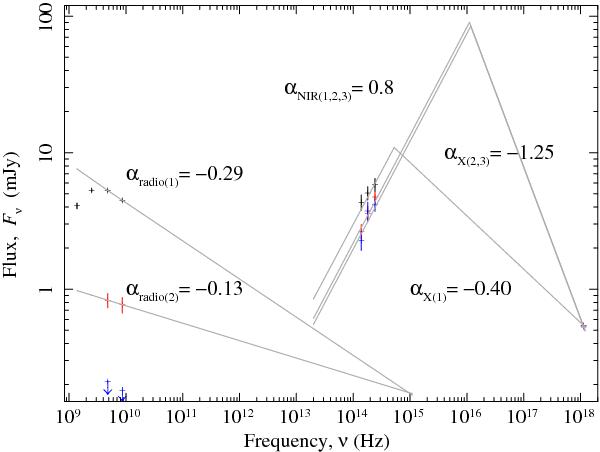
Dereddened/unabsorbed (except for radio) flux-versus-frequency plot at three epochs (1 = MJD 52 161, black; 2 = MJD 52 177, red; 3 = MJD 52 187, blue). Spectral indices, α, are from previously published sources, except for the NIR. Power laws are purely phenomenological in order to show the relative behavior at different frequencies.
Current usage metrics show cumulative count of Article Views (full-text article views including HTML views, PDF and ePub downloads, according to the available data) and Abstracts Views on Vision4Press platform.
Data correspond to usage on the plateform after 2015. The current usage metrics is available 48-96 hours after online publication and is updated daily on week days.
Initial download of the metrics may take a while.