Free Access
Fig. 6
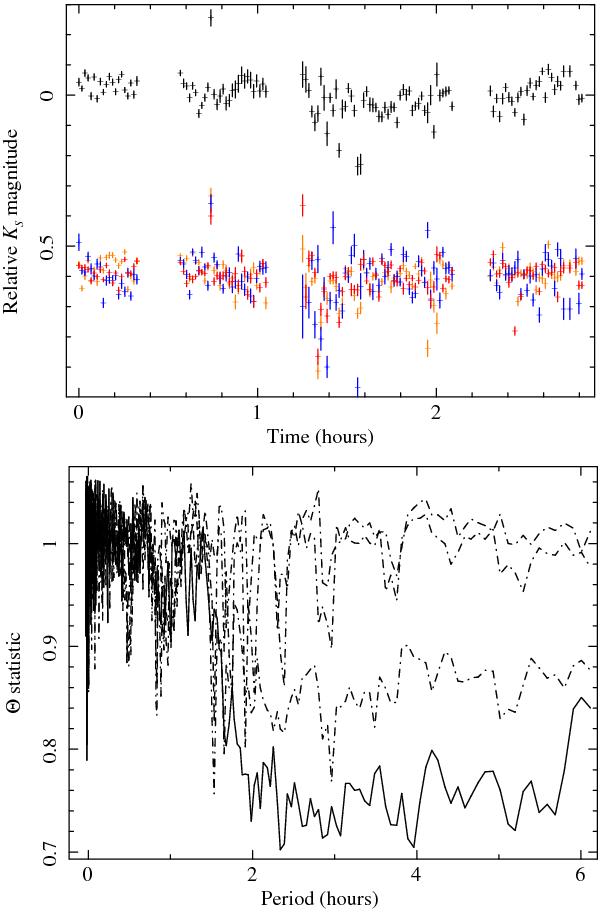
Top: high-cadence KS band light curve of the source along with three comparison objects of a similar magnitude (normalised to a relative magnitude of 0.6) and, bottom, the periodogram (Θ statistic versus period) for the source (solid line) and the nearby comparison objects (dashed lines).
This figure is made of several images, please see below:
Current usage metrics show cumulative count of Article Views (full-text article views including HTML views, PDF and ePub downloads, according to the available data) and Abstracts Views on Vision4Press platform.
Data correspond to usage on the plateform after 2015. The current usage metrics is available 48-96 hours after online publication and is updated daily on week days.
Initial download of the metrics may take a while.