Fig. 5
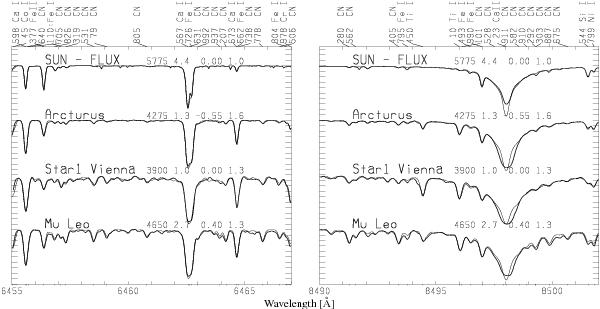
A4 analysis: the plot compares observed spectra (heavy lines) to calculated spectra (light lines) for Star 1 and three standard stars. The two panels display two separate wavelength regions, as indicated in Å at the bottom of each panel. The stars are displaced vertically for clarity. Each y-axis tick denotes 10% of the full height of the normalized spectrum. The star name appears in bold above the continuum of each plot, followed by the model stellar parameters adopted for the calculation: effective temperature Teff, surface gravity log g, logarithmic iron-to-hydrogen ratio [Fe/H] with respect to that of the Sun, and microturbulence vmic. Above the upper boundary of each panel appear identifications of the strongest lines in the calculation for μ Leo: the three digits after the decimal point of the wavelength in Å of the line is followed by a colon for a “missing” line, and then the species identification.
Current usage metrics show cumulative count of Article Views (full-text article views including HTML views, PDF and ePub downloads, according to the available data) and Abstracts Views on Vision4Press platform.
Data correspond to usage on the plateform after 2015. The current usage metrics is available 48-96 hours after online publication and is updated daily on week days.
Initial download of the metrics may take a while.