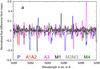
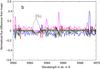
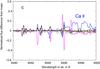
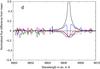
Fig. 14

Normalized flux differences from the mean for six different models, for four different wavelength regions. The six model codes appear across the bottom of panel a) in the colours used in the plots; a) blue region with relatively low rms difference; b) region containing Hα; c) region containing the IR Ca II triplet 8498 Å line; d) region with high rms difference due to differences in a strong Mg I line at 8807 Å.
Current usage metrics show cumulative count of Article Views (full-text article views including HTML views, PDF and ePub downloads, according to the available data) and Abstracts Views on Vision4Press platform.
Data correspond to usage on the plateform after 2015. The current usage metrics is available 48-96 hours after online publication and is updated daily on week days.
Initial download of the metrics may take a while.