Fig. 5
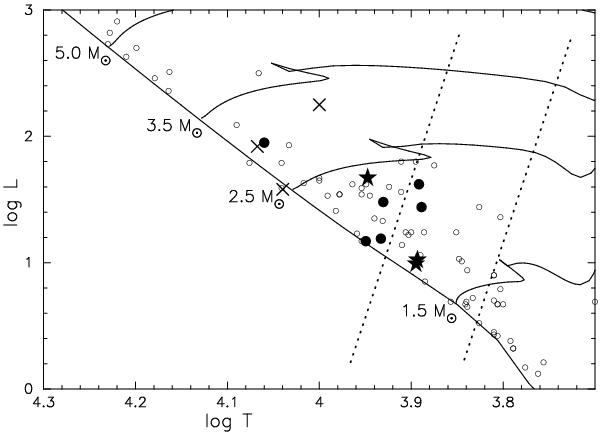
The positions of the 12 stars in the log L, log T plane. The smooth line and the small open circles dots, delineating the main sequence, are from Andersen (1991). The evolutionary tracks, drawn for specific masses as indicated, are described by Pols et al. (1998) and were calculated from software now in the public domain. The six large dots represent the definite or suspected λ Boo stars, the crosses the three CP stars, and the asterisks the “normal” members of the sample. The dotted lines suggest the limits of the instability strip.
Current usage metrics show cumulative count of Article Views (full-text article views including HTML views, PDF and ePub downloads, according to the available data) and Abstracts Views on Vision4Press platform.
Data correspond to usage on the plateform after 2015. The current usage metrics is available 48-96 hours after online publication and is updated daily on week days.
Initial download of the metrics may take a while.