Fig. 5
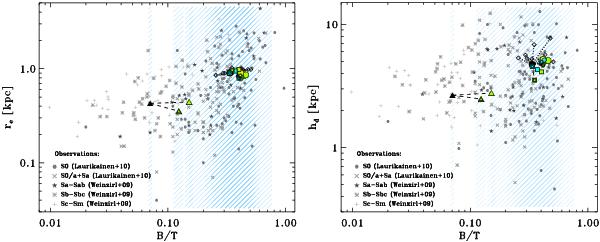
Growth vectors in the log (re)-log (B/T) and log (hD)-log (B/T) planes driven by our merger experiments, compared to the observational distributions of S0’s and spirals. The blue shaded region indicates the locations in the plane that are covered by our models just using a scaling different to the one indicated in Sect. 2. Consult the legend for the observational data in the figure. The legend for the models is the same as in Fig. 2.
Current usage metrics show cumulative count of Article Views (full-text article views including HTML views, PDF and ePub downloads, according to the available data) and Abstracts Views on Vision4Press platform.
Data correspond to usage on the plateform after 2015. The current usage metrics is available 48-96 hours after online publication and is updated daily on week days.
Initial download of the metrics may take a while.