Fig. 3
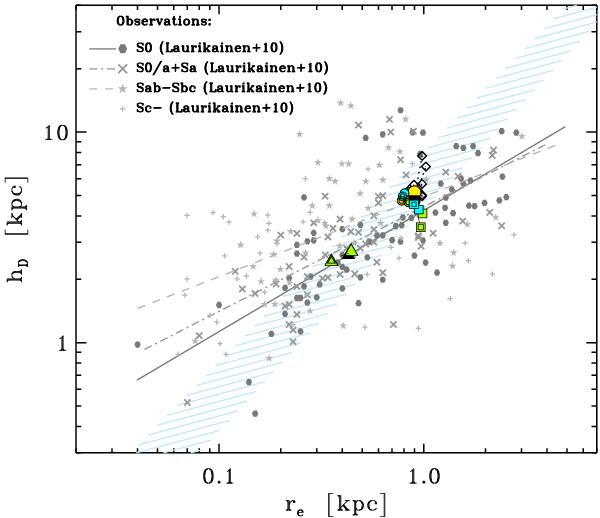
Growth vectors in the log (hD)-log (re) plane driven by our merger experiments, compared to the observed distributions of S0’s and spirals. The straight lines show the correlations found by L10 for different morphological types (red solid line: for the S0’s, blue dotted-dashed line: for the S0/a + Sa’s, green dashed line: for the Sab-Sbc’s). The blue shaded region indicates the locations in the plane that are covered by our models adjusting the scaling (see Sect. 2). Note that the change in both scale-lengths is negligible, making the remnants to basically overlap with the original location of the primary galaxies in the plane. Consult the legend for the observational data in the figure. The legend for the models is the same as in Fig. 2.
Current usage metrics show cumulative count of Article Views (full-text article views including HTML views, PDF and ePub downloads, according to the available data) and Abstracts Views on Vision4Press platform.
Data correspond to usage on the plateform after 2015. The current usage metrics is available 48-96 hours after online publication and is updated daily on week days.
Initial download of the metrics may take a while.