Fig. 2
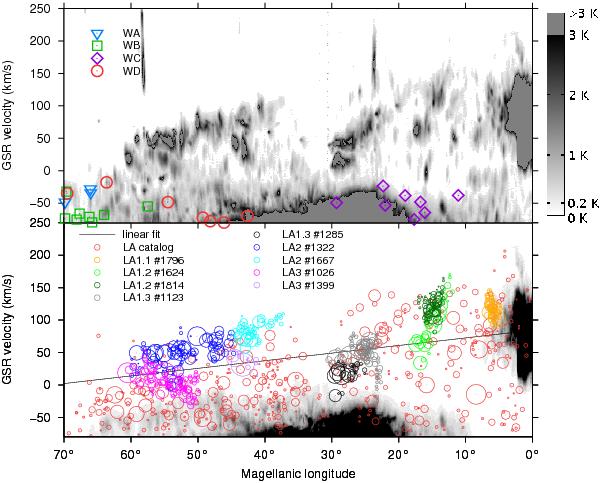
Top: position (lMS) versus velocity (vGSR) diagram showing the maximum brightness temperature distribution across −42.5° ≤ bLMC ≤ 42.5° across the whole velocity range of interest (starting at TB = 200 mK up to 3 K on a linear scale). On the righthand side the LMC Hi emission, while the Milky Way emission is visible towards the bottom. The narrowly confined high-velocity dispersion emission lines are associated with nearby galaxies covered by GASS. Obvious is a continuous velocity gradient of the Hi emission above the Galactic plane from the LMC systemic velocity to vGSR = 0 km s-1. The location of clouds belonging to the Wannier complexes WA, WB, WC, and WD are annotated. Bottom: the colored circles denote the location of the individual LA catalog objects while the gray-scale figure represents the “edge objects”, the Milky Way and the LMC. Each color marks an individual LA cloud complex (the ID of the catalog – available at the CDS – entry is given), aiming to demonstrate the coherent velocity structure of the complexes. The circle diameter scales according to  . The regression line marks the mass–weighted velocity gradient with its LMC value of vGSR = 84.2 ± 7 km s-1 demonstrating that the LA gas most likely is released from the LMC gaseous body.
Current usage metrics show cumulative count of Article Views (full-text article views including HTML views, PDF and ePub downloads, according to the available data) and Abstracts Views on Vision4Press platform.
Data correspond to usage on the plateform after 2015. The current usage metrics is available 48-96 hours after online publication and is updated daily on week days.
Initial download of the metrics may take a while.