Fig. 1
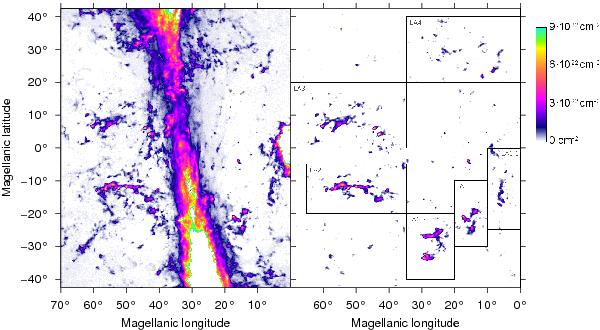
Left: the map shows the column density distribution of the Hi 21-cm line emission across the velocity interval −80 km s-1 ≤ vGSR ≤ 250 km s-1. The complex Hi structure is produced by the superposition of the Milky Way galaxy emission, the LMC, and the LA. Right: the column density distribution of LA clouds across −80 km s-1 ≤ vGSR ≤ 250 km s-1 starting at a threshold of ΔTB = 200 mK (4-σ level of the GASS data). All the objects shown are cataloged and parametrized. Coherent structures like the Milky Way disk and LMC emission are according to the applied criteria “border” objects and not part of the catalog. The boxed and labeled areas enclose coherent structures in the data cube. Objects outside these areas also belong most likely to the LA. Note: white colors inside regions with disk emission denote column densities in excess of NHI = 9 × 1022 cm-2.
Current usage metrics show cumulative count of Article Views (full-text article views including HTML views, PDF and ePub downloads, according to the available data) and Abstracts Views on Vision4Press platform.
Data correspond to usage on the plateform after 2015. The current usage metrics is available 48-96 hours after online publication and is updated daily on week days.
Initial download of the metrics may take a while.