Fig. 6
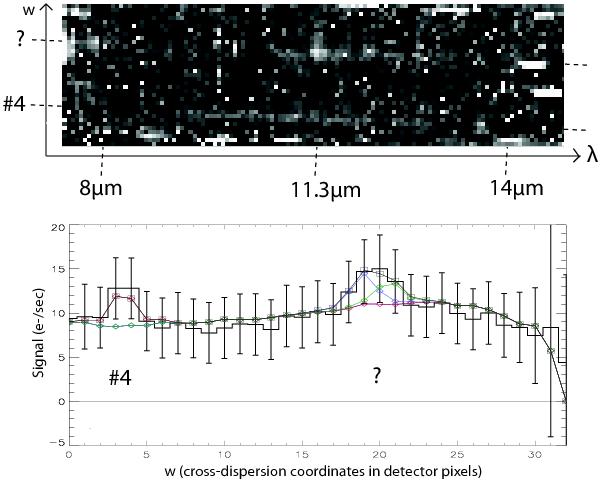
Example of optimal spectral extraction (source #4). The detector image is shown in the top panel, after background subtraction, with the cross-dispersion profile (w) as a function of wavelength. The corresponding profile along the aperture (integrated signal over the wavelength range vs. w) is shown as a histogram in the bottom panel. The connected squares show the fit of the spatial components in the slit, including source #4 (red profile), the extended background emission, and another slightly extended source in IC 10 matching the location of the H ii region [HL90] 17 (Hodge & Lee 1990), here fitted with 2 point-like sources showed by the green and blue profiles.
Current usage metrics show cumulative count of Article Views (full-text article views including HTML views, PDF and ePub downloads, according to the available data) and Abstracts Views on Vision4Press platform.
Data correspond to usage on the plateform after 2015. The current usage metrics is available 48-96 hours after online publication and is updated daily on week days.
Initial download of the metrics may take a while.