Fig. 5
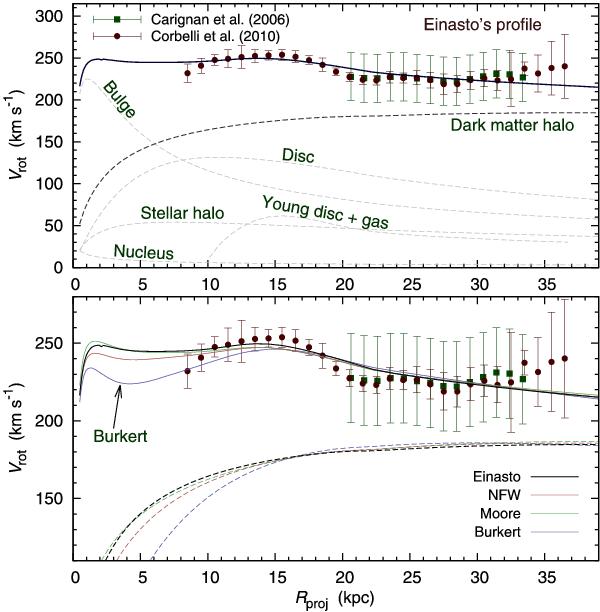
Upper panel: the observed rotation curve (data points with error bars) overplotted with the model (solid line). Contributions of each component are also shown (dashed lines). The model corresponds to the B07 stellar mass estimates and the Einasto distribution for the DM density. Lower panel: the same stellar model with four different DM density distributions. For clarity, only the total rotation curves and the DM contributions are shown.
Current usage metrics show cumulative count of Article Views (full-text article views including HTML views, PDF and ePub downloads, according to the available data) and Abstracts Views on Vision4Press platform.
Data correspond to usage on the plateform after 2015. The current usage metrics is available 48-96 hours after online publication and is updated daily on week days.
Initial download of the metrics may take a while.