Fig. 3
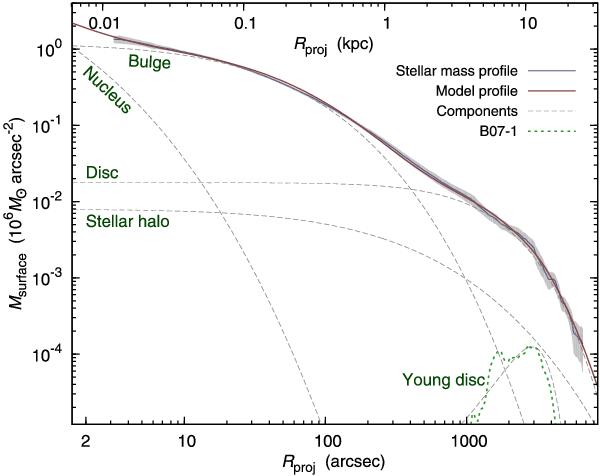
Mass-density distribution of the galaxy, averaged along elliptical iso-density contours, as inferred from the B07 model (thick grey line; its thickness indicates deviations along each ellipse), the model profile (solid line) and the contributions of the individual stellar components (dashed lines) to the model profile. The contribution of the model population B07-1 to the mass distribution is also shown; it is closely traced by the young disc component of the model.
Current usage metrics show cumulative count of Article Views (full-text article views including HTML views, PDF and ePub downloads, according to the available data) and Abstracts Views on Vision4Press platform.
Data correspond to usage on the plateform after 2015. The current usage metrics is available 48-96 hours after online publication and is updated daily on week days.
Initial download of the metrics may take a while.