Fig. 10
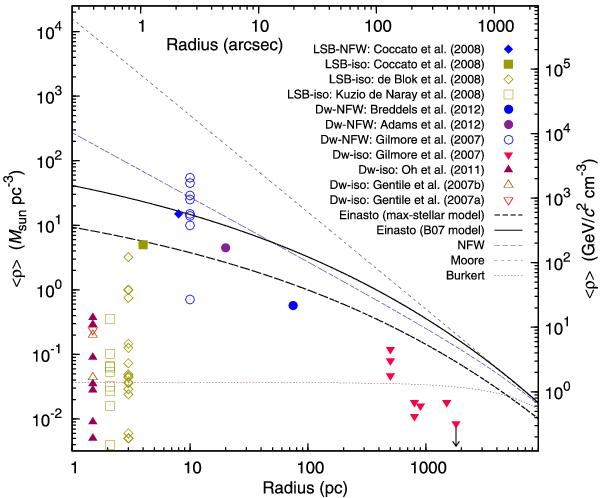
Average DM density inside a given radius, corresponding to different DM distributions in the case of the B07 stellar masses. For the Einasto DM distribution, also the maximum-stellar-mass case is plotted. For comparison, central densities of some nearby dwarf galaxies and low-surface-brightness galaxies are shown. The triangular/quadrangular datapoints are calculated assuming the Burkert DM, the circular datapoints correspond to the NFW DM.
Current usage metrics show cumulative count of Article Views (full-text article views including HTML views, PDF and ePub downloads, according to the available data) and Abstracts Views on Vision4Press platform.
Data correspond to usage on the plateform after 2015. The current usage metrics is available 48-96 hours after online publication and is updated daily on week days.
Initial download of the metrics may take a while.