Fig. 1
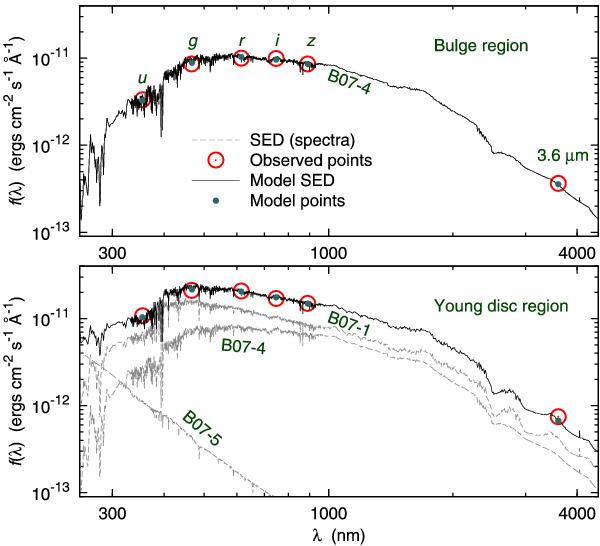
Examples of the observed (large circles) and modelled (lines) SED for a random pixel in the bulge region (upper panel) and in the young disc region (lower panel). The sizes of the datapoints indicate the photometric uncertainties of each measurement. The model values corresponding to each filter are also shown (small datapoints). In most pixels, the reddest model population (B07-4) alone provides a good representation of the observed SED. In the young disc regions, the stellar populations are more diverse: in the lower panel, the B07 model populations 1, 4 and 5 contribute 24.44%, 75.52%, and 0.04% of the mass, respectively. The corresponding SEDs are weighted according to the mass fraction. In this plot, the observed SEDs and the sum of the weighted model spectra are normalised per 1 M⊙ at a distance of 10 pc.
Current usage metrics show cumulative count of Article Views (full-text article views including HTML views, PDF and ePub downloads, according to the available data) and Abstracts Views on Vision4Press platform.
Data correspond to usage on the plateform after 2015. The current usage metrics is available 48-96 hours after online publication and is updated daily on week days.
Initial download of the metrics may take a while.