Fig. 6
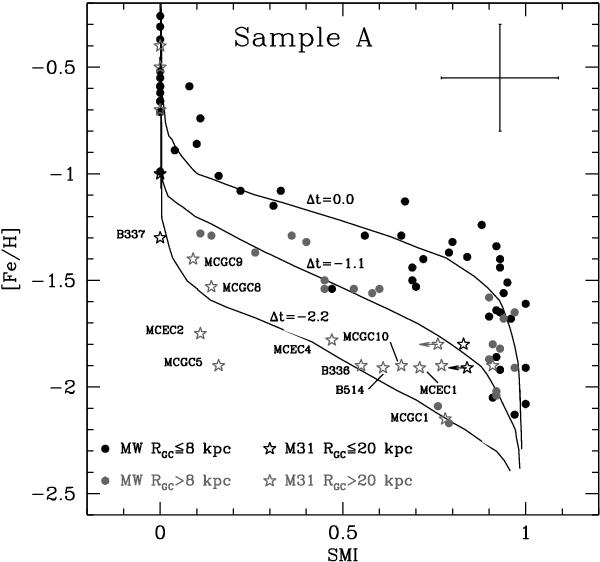
The SMI vs. metallicity diagram. The Galactic GCs are plotted as filled circles, the M 31 Sample A GCs as open stars. The symbol color code shows the galacto-centric distance of the cluster, as described in the bottom-left corner of the panel. The RGC = 20 kpc threshold was somehow arbitrarily adopted for Sample A clusters to highlight those that cannot be considered as exceptionally far, since it correspond to the radius containing ≈ 90% of the whole population of confirmed M 31 GCs (see Fig. 5). Arrows indicate upper limits. Solid lines are isochrones from the synthetic HB models by Rey et al. (2001), and are labelled according to their age difference in Gyr. Typical error-bars for M 31 GCs are shown in the top-right corner. Sample A clusters lying near the Δt = −2.2 Gyr isochrone are labelled.
Current usage metrics show cumulative count of Article Views (full-text article views including HTML views, PDF and ePub downloads, according to the available data) and Abstracts Views on Vision4Press platform.
Data correspond to usage on the plateform after 2015. The current usage metrics is available 48-96 hours after online publication and is updated daily on week days.
Initial download of the metrics may take a while.