Free Access
Fig. 7
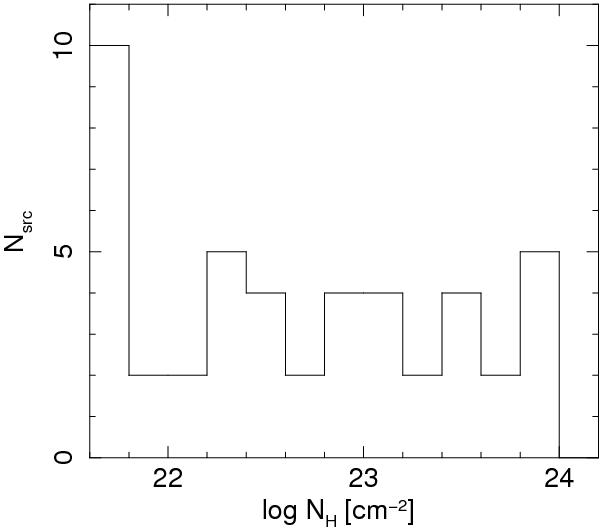
Distribution of absorbing column density NH, obtained by fitting an absorbed power-law to the EPIC spectra. The lowest bin represents the number of objects with no detection of absorption. The typical error bar of each bin is ± 1.
Current usage metrics show cumulative count of Article Views (full-text article views including HTML views, PDF and ePub downloads, according to the available data) and Abstracts Views on Vision4Press platform.
Data correspond to usage on the plateform after 2015. The current usage metrics is available 48-96 hours after online publication and is updated daily on week days.
Initial download of the metrics may take a while.