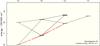
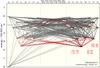
Fig. 2
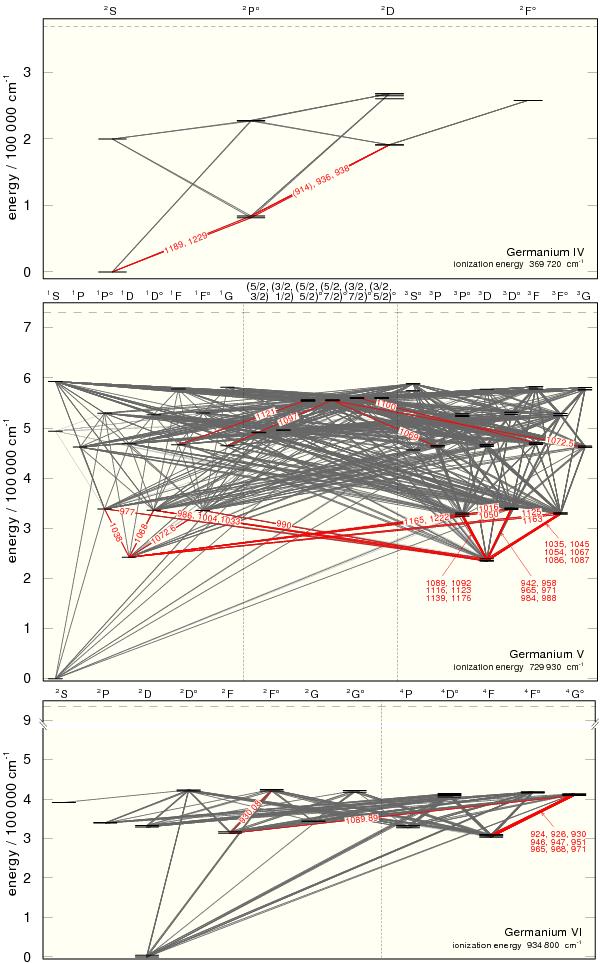
Grotrian diagram of our Ge IV (top), Ge V (middle), and Ge VI (bottom) model ions. Thick black and thin gray lines represent radiative transitions with known and unknown f values, respectively. The identified lines (red) are labeled with their respective wavelengths in Å.
Current usage metrics show cumulative count of Article Views (full-text article views including HTML views, PDF and ePub downloads, according to the available data) and Abstracts Views on Vision4Press platform.
Data correspond to usage on the plateform after 2015. The current usage metrics is available 48-96 hours after online publication and is updated daily on week days.
Initial download of the metrics may take a while.