Free Access
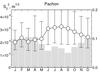
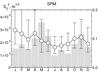
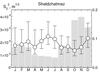
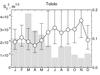
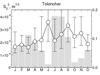
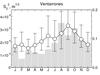
Fig. 8
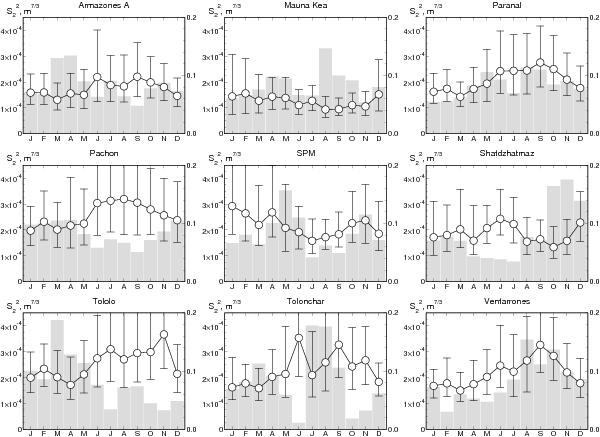
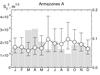
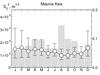
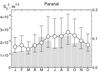
Seasonal variation of the scintillation parameter  . Monthly medians are plotted as circles, the quartiles are indicated by bars. The grey bars show the share of the measurements (right axis) entering the respective month.
This figure is made of several images, please see below:
Current usage metrics show cumulative count of Article Views (full-text article views including HTML views, PDF and ePub downloads, according to the available data) and Abstracts Views on Vision4Press platform.
Data correspond to usage on the plateform after 2015. The current usage metrics is available 48-96 hours after online publication and is updated daily on week days.
Initial download of the metrics may take a while.